Finance creates decision value when it connects reliable transaction records to an explicit explanation of the business choices available. More dashboards do not establish that connection. The important change is a disciplined route from recorded results to an economic question, an operational hypothesis, an authorized action, and a check of what happened afterward.
For an FP&A leader, the design decision is which recurring management decision deserves a financial model and an operating feedback loop. Start with a choice people actually control, such as allocating constrained delivery capacity or selecting accounts for a service review. A report that produces interesting observations without changing a decision can still be informative, but it should not be mistaken for an effective decision process.
Reliable bookkeeping remains essential. The analytical layer needs a reconciled base, consistent definitions, and traceable adjustments. Adding operational context should make the financial view more interpretable without obscuring where recorded facts end and assumptions begin.
A useful decision statement identifies the owner, alternatives, horizon, constraint, and evidence. “Improve margin” is an objective. “Decide how to allocate next month’s limited installation hours between two service packages, given contracted demand and delivery commitments” is a decision that can be modeled.
Ask the owner which action would change if the information changed. If no plausible answer emerges, the proposed metric may be a monitoring measure rather than a decision input. That is not a defect, but it changes the design. Monitoring needs meaningful alerts and escalation; an allocation decision needs alternatives, tradeoffs, and an understanding of constraints.
Separate the time horizons. A decision about next week’s capacity may depend on incremental cost and available staff. A decision about next year’s service portfolio may also need investment, fixed costs, risk, and strategic fit. One profitability metric cannot answer both without additional analysis.
Define how the financial model connects to the ledger. Management measures may use alternative groupings or relevant operational estimates, but the bridge should remain visible. An executive should be able to understand why a contribution measure differs from reported profit rather than assuming one of the figures is wrong.
A result can change because of volume, selling price, product mix, input cost, productivity, timing, or changes in measurement. Build a bridge that isolates the effects relevant to the decision, using a documented calculation order where effects interact.
The order matters. When both price and volume change, an attribution method must decide how to handle their interaction. Different valid methods can allocate the combined effect differently. Choose a method, explain it, and use it consistently rather than presenting the resulting labels as uniquely determined facts.
Causal explanations require more than an arithmetic bridge. A rise in support costs might reflect more incidents, more complex customers, a different service promise, or changed recording behavior. The financial variance identifies where to investigate. Operational evidence is needed to establish the cause.
Present three levels explicitly: observed fact, plausible explanation, and confirmed cause. This prevents a management discussion from turning the first coherent story into an accepted diagnosis. It also lets operational teams contribute facts rather than simply defend themselves against a financial interpretation.
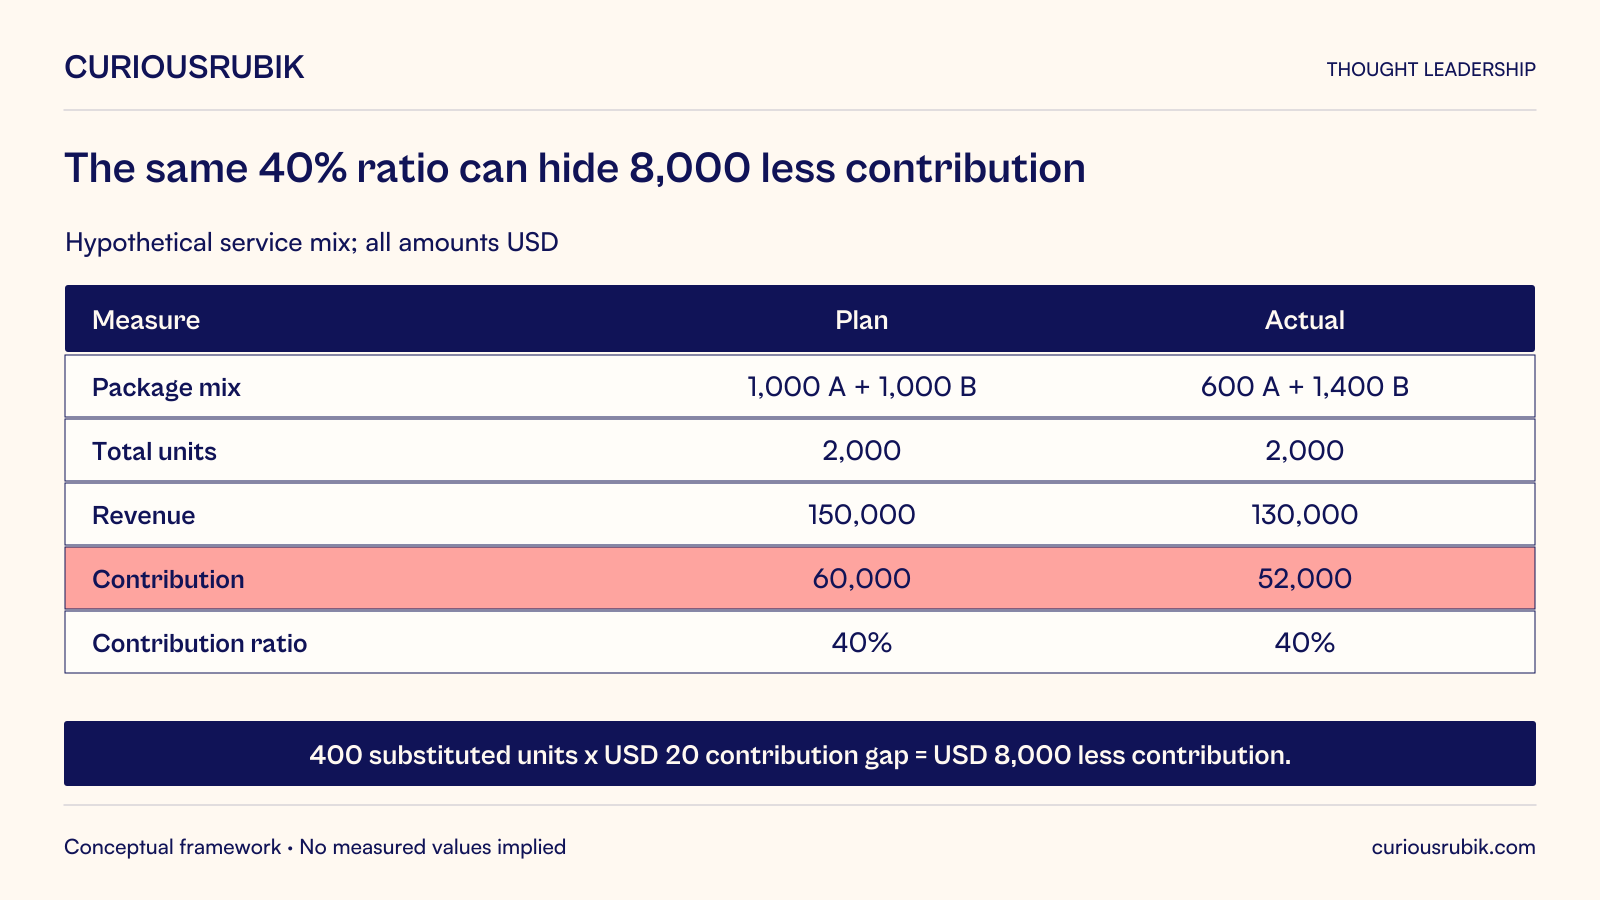
Consider a hypothetical business selling two service packages. Package A has a selling price of USD 100 and a defined variable cost of USD 60, giving USD 40 contribution per unit. Package B sells for USD 50 with USD 30 variable cost, giving USD 20 contribution. These are simplified internal management measures, not financial-reporting classifications.
The plan assumes 1,000 units of each package. Planned revenue is USD 150,000 and contribution is USD 60,000. Actual volume is 600 units of A and 1,400 units of B. Prices and variable costs are unchanged. Actual revenue is USD 130,000 and contribution is USD 52,000.
Total units remain 2,000, and the contribution percentage remains 40 percent in both cases. Yet contribution falls by USD 8,000. Replacing 400 units of A with 400 units of B explains the difference: 400 multiplied by the USD 20 contribution gap. A dashboard showing only units and contribution percentage would miss an important absolute change despite containing correct data.
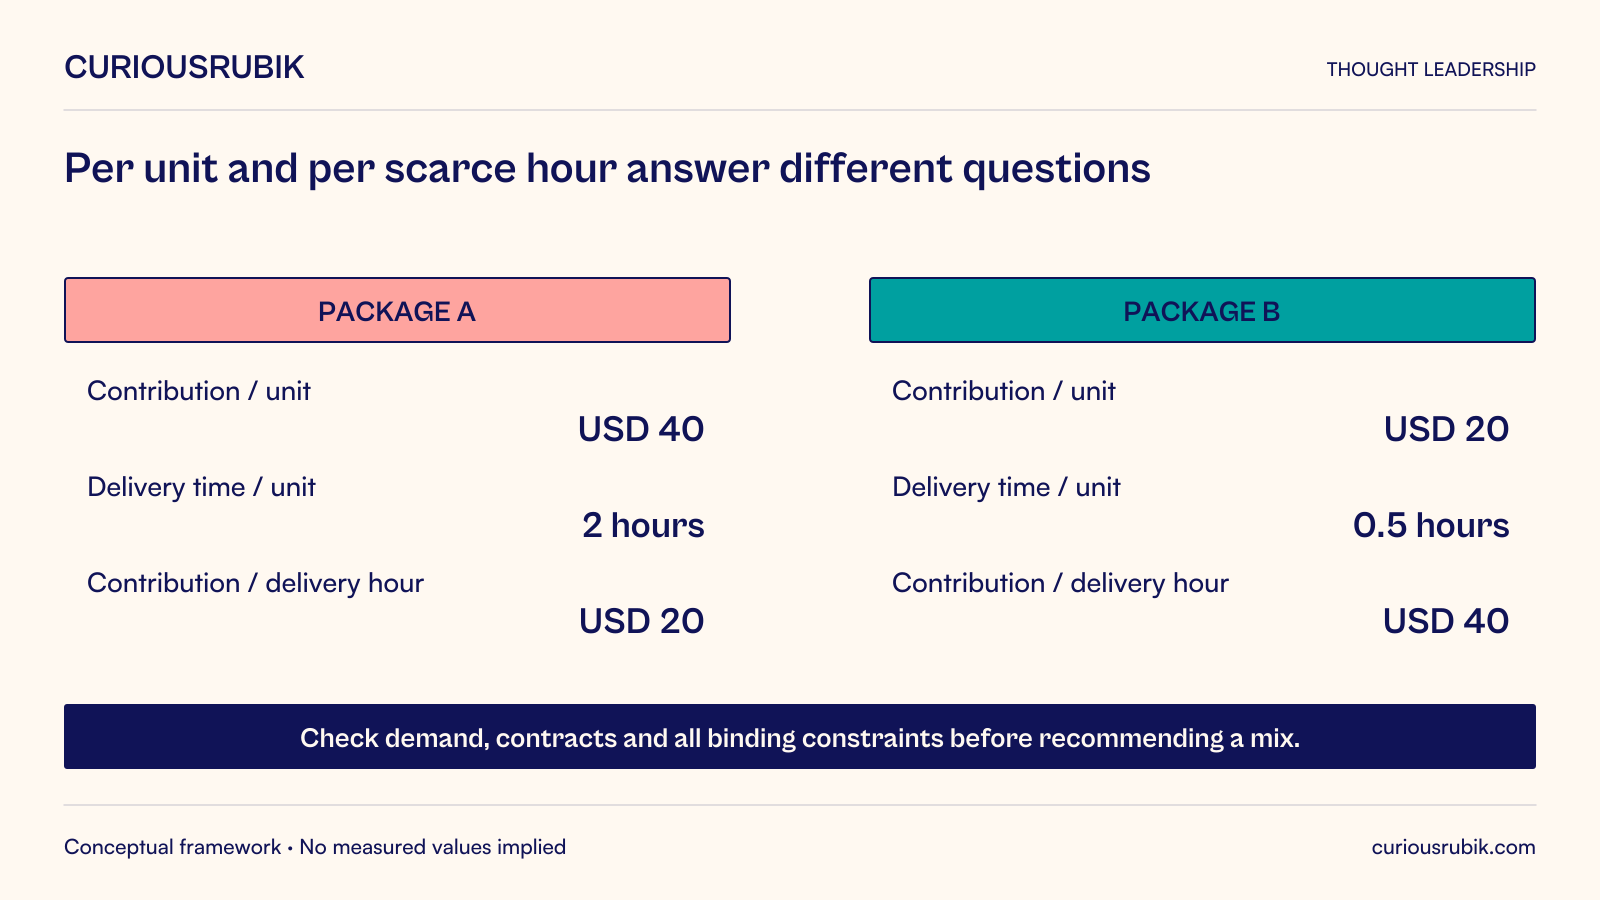
It might seem obvious to push more sales of A. Now add an operational constraint: assume A needs two delivery hours per unit and B needs half an hour. A generates USD 20 contribution per delivery hour, while B generates USD 40. Under a binding delivery-hour constraint, and only under these simplified assumptions, B may use the scarce resource more productively.
This does not establish that the business should stop selling A. Demand, contractual obligations, other scarce resources, quality, fixed costs, strategic effects, and the feasibility of changing the mix all matter. It establishes that contribution per unit and contribution per constrained hour answer different questions.
The planned mix consumes 2,500 delivery hours; the actual mix consumes 1,900, leaving a difference of 600 hours in this example. Whether those hours have value depends on whether they can be redeployed, avoided, or used to meet other demand. A lower contribution total and released capacity can coexist. Finance needs to explain both before recommending action.
The model should state the decision variables, constraints, relevant costs, and assumptions. For the service example, include feasible demand by package, committed work, available delivery hours, and any other bottleneck. Keep uncertain inputs distinct from recorded quantities.
Do not add complexity merely because data is available. A model that includes many weak assumptions can appear sophisticated while becoming harder to challenge. Start with the variables that could change the choice, and test whether omitted factors are likely to reverse the conclusion.
Use sensitivity analysis to identify the assumptions worth resolving. If a small change in available delivery hours changes the preferred mix, capacity evidence deserves attention. If the recommendation remains the same across a credible range, more precision in that input may not improve the decision.
Avoid presenting the model’s preferred answer as a command. The decision owner should see the feasible alternatives, the reasons they differ, and what the model excludes. Finance contributes disciplined economic reasoning; operations contributes feasibility and business context. The authorized manager remains responsible for the action.
A decision meeting should produce a record of the action, owner, expected effect, assumptions, and review point. Without this record, the next meeting can become a fresh interpretation of the latest numbers with no learning about previous decisions.
For the hypothetical packages, management might authorize a limited scheduling trial for a defined customer segment, subject to existing commitments. The expected effect should identify the relevant outcome, such as contribution from the constrained hours, rather than simply a change in sales mix. The trial needs a baseline and a way to distinguish its effect from changes in demand or service quality.
Do not claim causation from a before-and-after comparison alone when other factors changed. A comparable group, staggered rollout, or carefully documented operational evidence may strengthen interpretation, depending on the situation. The method should match the decision’s consequence and the practical limits of the business.
When results differ from expectations, examine the model and execution separately. The action may not have been implemented as intended, the assumptions may have been wrong, or an external event may have changed the context. Treat the review as an opportunity to improve the decision process rather than to defend the original forecast.
A recurring analytical product needs an owner for definitions, source quality, model changes, and the meeting in which it is used. Finance and the business should agree what constitutes a meaningful change and who can approve it. Otherwise, a model can drift as analysts make individually reasonable adjustments without preserving comparability.
Maintain an explanation layer alongside the visual output. Show the source period, population, important assumptions, and reconciliation bridge. The Basel Committee’s 2013 reporting principles emphasize clarity and usefulness for their banking audience. Applying that principle to a general management decision product is an analogy, not an assertion that banking reporting rules govern every business. BCBS 239, Principle 9
There are limits to finance-led analysis. A model may not capture customer trust, employee workload, strategic commitments, or the value of keeping options open. Include those considerations in the decision record instead of assigning unsupported monetary values simply to force them into the spreadsheet.
Before each use, check whether the constraint still binds. If delivery hours become abundant but specialist equipment becomes scarce, the old per-hour ranking may no longer answer the current question. Similarly, a package price change or a new service obligation can invalidate a previously useful contribution calculation. Record these triggers in the model instructions and assign someone to reassess them. A decision product needs this maintenance just as a financial report needs a reliable refresh.
Choose one recurring management meeting and replace one backward-looking metric discussion with a complete decision question. Provide a reconciled baseline, a simple economic model, explicit alternatives, and a review date. The evolution from bookkeeping to business intelligence becomes useful when the organization can see how better evidence changed an action and what it learned from the result.