A workshop reduces handling cost by releasing work in larger batches. The local cost report improves, but more customer jobs sit unfinished and delivery becomes less predictable. The business may still have made a sensible tradeoff, but cost per activity cannot establish that on its own.
Operational efficiency should describe how well resources produce accepted outcomes under the service conditions the business has chosen. That includes flow, quality, reliability, and the capacity to respond when conditions change. A lower expense figure achieved by delaying work or exporting effort is not automatically a more efficient service.
The measurement task is to connect resource use with the complete flow of comparable work. This article uses a hypothetical picture-framing workshop and a carefully bounded queue relationship to show what a cost-only view misses. The calculations are illustrative, not a measured result or a recommendation to operate at a particular workload level.
Choose a unit that represents useful work: an accepted frame order, a resolved service case, or a completed delivery meeting the relevant requirements. Counting an intermediate activity can overstate output if the result needs correction or cannot yet be used.
Specify which resources are included. Direct labor, equipment, support, rework, and customer effort may sit in different budgets. A local cost reduction can move work to another participant without reducing the total burden. Keep that distinction visible.
Use a consistent population. Comparable jobs should have reasonably similar work content, or the analysis should account for relevant differences. A change in size, customization, or required handling can alter resource use even when the number of completed jobs is unchanged.
Separate financial cost from physical or human effort. They are related but not identical. A lower accounting charge may reflect a different allocation or price, while the operation consumes the same capacity. Conversely, released capacity may improve service without immediately reducing cash expenditure.
Work in progress is accepted work that has entered the defined process but has not reached its completion boundary. It can reveal a burden that unit-cost reporting misses: unfinished jobs occupy attention, space, and coordination effort while customers continue to wait.
Track incoming work, accepted completions, and unresolved work together. A strong completion count can coexist with a growing backlog if arrivals increase faster. Excluding delayed jobs until they finish can make completed-case measures look healthy during deterioration.
Use averages appropriate to the question. A single day’s queue snapshot is not the same as average work in progress over a stable period. The relationship between flow, rate, and time requires consistent boundaries and assumptions, not a convenient division of whatever numbers the dashboard displays.
John Little’s 1961 paper establishes a relationship between mean units in a system, mean arrival rate, and mean time under stated stationary, finite-mean conditions. The hypothetical application below assumes stable flow with matching long-run arrivals and completions. It is not a forecast for an individual job. A Proof for the Queuing Formula, 1961
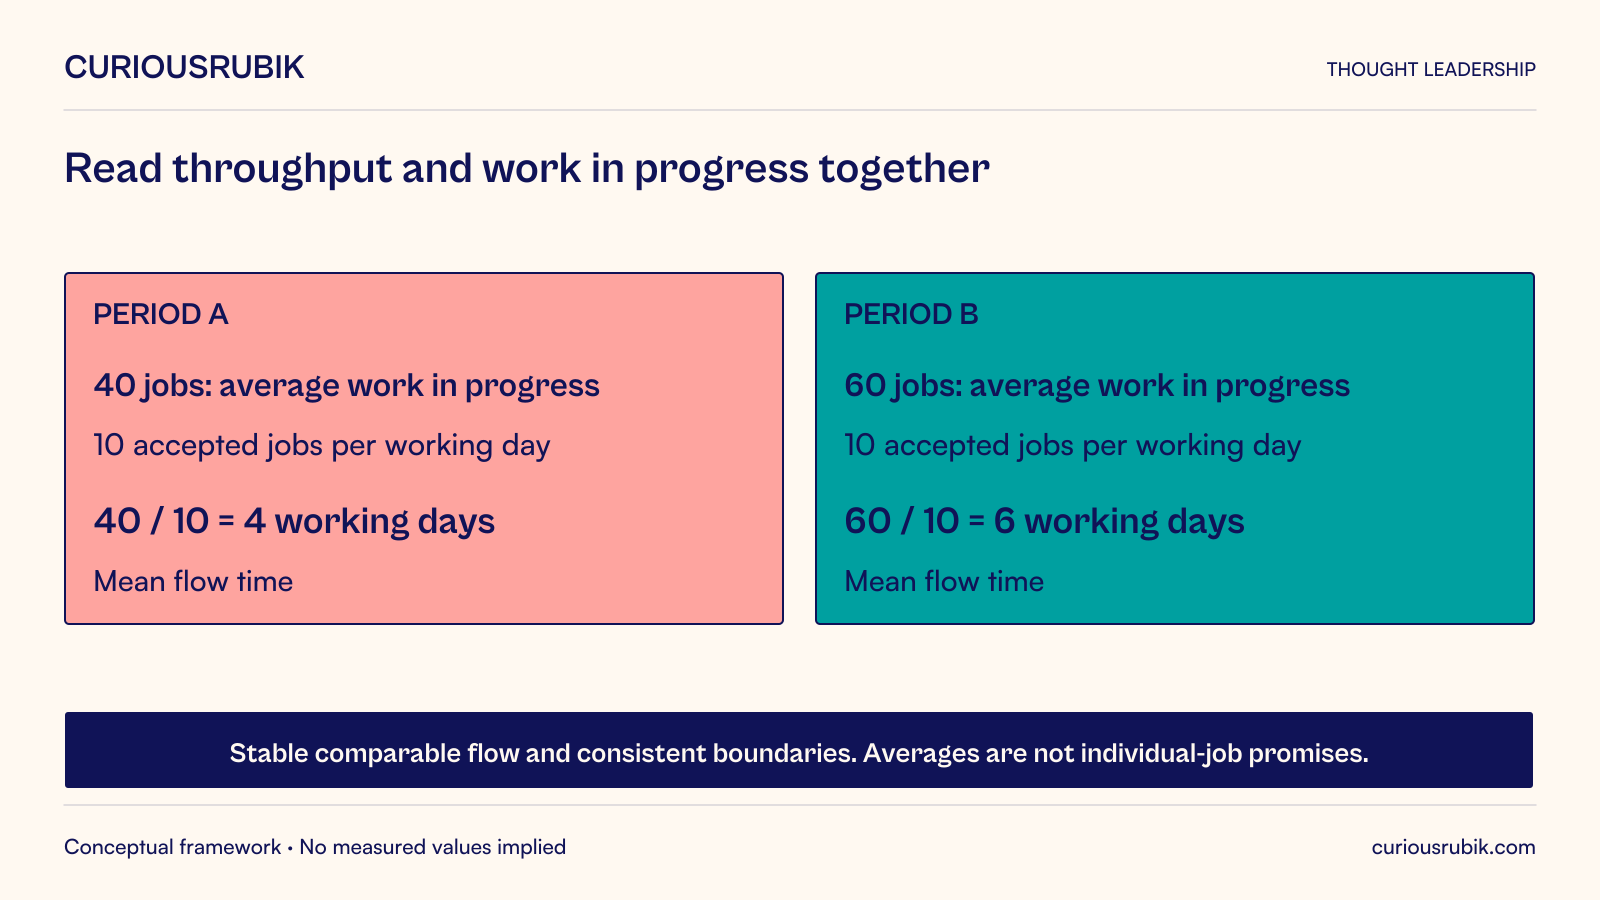
Imagine a workshop serving galleries with a defined class of comparable frame orders. In one hypothetical stable operating period, average work in progress is 40 jobs and average accepted completion rate is ten jobs per working day. Under the stated stable-flow assumptions, mean time inside the boundary is four working days: 40 divided by ten.
In a second hypothetical stable period, average work in progress is 60 jobs while accepted throughput remains ten jobs per working day. The corresponding mean time is six working days. The increase in unfinished work accompanies a longer average flow time without a higher accepted output rate.
These quantities are invented and assume the same process boundary, comparable work, finite averages, and no persistent imbalance between arrivals and departures. They should not be applied mechanically to a rapidly growing backlog, a short unstable observation window, or mismatched populations.
Suppose the second operating arrangement reduces some local handling effort through batching. That benefit needs to be assessed alongside the additional time and work in progress. Customers may value predictable completion enough that a small handling saving is not attractive, or the business may accept the delay for a clearly defined service tier.
The relationship does not explain why the queue grew or prescribe the remedy. The workshop should examine release policy, resource constraints, missing materials, rework, and priority changes. Simply reducing the visible queue by moving jobs outside the measurement boundary would not improve the customer’s experience.
The useful management conclusion is that cost, throughput, and flow time must be read together. The same ten accepted jobs per day can come from operating arrangements with different waiting, coordination, and service consequences.
Reconcile the underlying records before using the comparison. Jobs transferred to another location, canceled, or reopened need a consistent treatment. Counting a reopened job as a new arrival while retaining its original time can mix incompatible units. Define whether the unit is a customer order or a processing visit, and use that same unit throughout.
Also inspect the observation period. A holiday closure, an initial backlog clearance, or a large one-off arrival can make a short interval unrepresentative of stable operation. The relationship remains useful as a disciplined question about flow, but the business should not manufacture precision from a period that does not support the assumptions.
Measure accepted output rather than gross activity alone. Include rework, returns, and material corrections using definitions appropriate to the service. A team that produces more first-pass work but requires extensive correction may consume more total capacity.
Track commitment reliability. The average job may finish quickly while a subset repeatedly misses its promised date. Review the distribution and the oldest unresolved cases, not only a mean. Different service classes may legitimately have different commitments.
Inspect the effect on receiving teams and customers. If workshop output requires more clarification at collection or installation, the local productivity measure is incomplete. The service should account for work needed to make the result usable.
Avoid combining every measure into a single score before understanding the tradeoffs. A composite can hide a worsening quality result behind a favorable cost change. Start with a small set of measures that supports the actual operating decision, with explicit conditions that must not deteriorate.
High utilization can mean that a resource is productively engaged, but it can also mean it has little room to absorb variation or recover from disruption. Evaluate whether the utilization target supports the service promise rather than assuming the highest possible value is always desirable.
Identify the actual constraint. Improving a non-constrained activity may create more work in progress without increasing accepted output. A local productivity project should explain how its change affects the complete flow and what receiving capacity is available.
Measure the capacity needed for maintenance, learning, support, and ordinary absence. Treating all time outside direct production as waste can remove the activities that keep the service dependable. The appropriate level requires evidence from the operation.
Separate an intentional reserve from unexplained idle time. Both deserve visibility, but they are different management questions. The business can evaluate the cost and service value of resilience without pretending it is free or automatically excessive.
For a proposed change, state the expected mechanism. Larger batches may reduce setup or handling while increasing waiting. Better intake may reduce rework. A clearer priority rule may improve reliability for a chosen service class while changing another class’s lead time.
Measure the relevant effects before and after under comparable conditions. Record changes in demand, mix, staffing, and operating policy. A descriptive improvement is useful, but attributing it entirely to one intervention may require a stronger evaluation design.
Look for displaced or deferred cost. A maintenance reduction can lower current expenditure while increasing future disruption. A faster handoff can transfer incomplete work. A backlog reduction can be cosmetic if cases are closed without an accepted resolution.
Use case review to explain surprising metrics. Select jobs that completed well, waited unusually long, or required repeated correction. The trace can reveal a missing material, a policy conflict, or a poor measurement definition that an aggregate indicator cannot diagnose.
A practical review can examine accepted throughput, work in progress, elapsed time, quality, and resource effort for a defined service population. Add commitment reliability or resilience measures where they change the decision. Keep each definition and data owner clear.
Discuss the tradeoff being considered rather than celebrating every downward cost movement. If a proposed arrangement saves handling but lengthens customer waiting, decide whether that fits the service strategy and what mitigation is needed. The metric informs the choice; it does not make the value judgment.
Agree who can change release policy, staffing, service promises, or process design. Measurement without authority to act becomes an observation service. Keep a record of the decision and examine whether the expected result follows.
The framing workshop’s next review should therefore ask more than whether handling cost fell. It should establish whether comparable work reaches accepted completion with the intended quality and reliability, and what resources the whole process consumes. Efficiency improves when those relationships become better, not merely when one visible cost becomes smaller.