Thirty days without a major outage can be reassuring and still provide an incomplete picture of system stability. The business may have processed little volume, avoided difficult transactions, or relied on consultants to repair records before users noticed.
A useful early-life scorecard measures whether important work completes correctly and predictably under the actual operating load. It also shows the manual effort required to keep that result true and the business cycles not yet observed.
For a service owner, the decision is whether to continue concentrated support, expand usage, reduce restrictions, or move toward ordinary operation. The first thirty days provide evidence for that decision. They are not a universal certification period after which a service becomes stable automatically.
Technical availability answers whether a service can respond. Business completion answers whether the intended work reaches the required result. Data integrity answers whether records remain correct and reconcilable. Recoverability answers whether the team can restore operation after a problem.
These dimensions can diverge. A system may respond quickly while producing incorrect results. A process may complete successfully only because support performs extensive manual correction. A reliable daily workflow may coexist with an untested month-end process.
Choose the important user journeys and business cycles for the release. Define success, acceptable timing, relevant data conditions, and the population being measured. Keep the initial set small enough that each measure has an owner and a clear interpretation.
The SRE treatment of service-level objectives distinguishes indicators from targets and emphasizes measures relevant to users. That discipline is useful for enterprise launches, where a generic uptime percentage rarely captures the whole operating outcome. Site Reliability Engineering, Service Level Objectives.
A success rate requires a clearly defined eligible population. Are you counting user attempts, logical transactions, completed jobs, or records due within a period? Retries and duplicates can change the answer materially.
State the numerator as precisely as the denominator. “Successful” might mean accepted by an application, posted downstream, reconciled, or completed within an agreed time. Those are different claims.
Include unresolved cases explicitly. A transaction that has not reached its deadline differs from one that is late. A case with an unknown outcome should not silently disappear from the calculation.
Preserve the definitions through the observation period. If the team changes a measure to correct a flaw, annotate the change and avoid comparing the old and new figures as though they were identical.
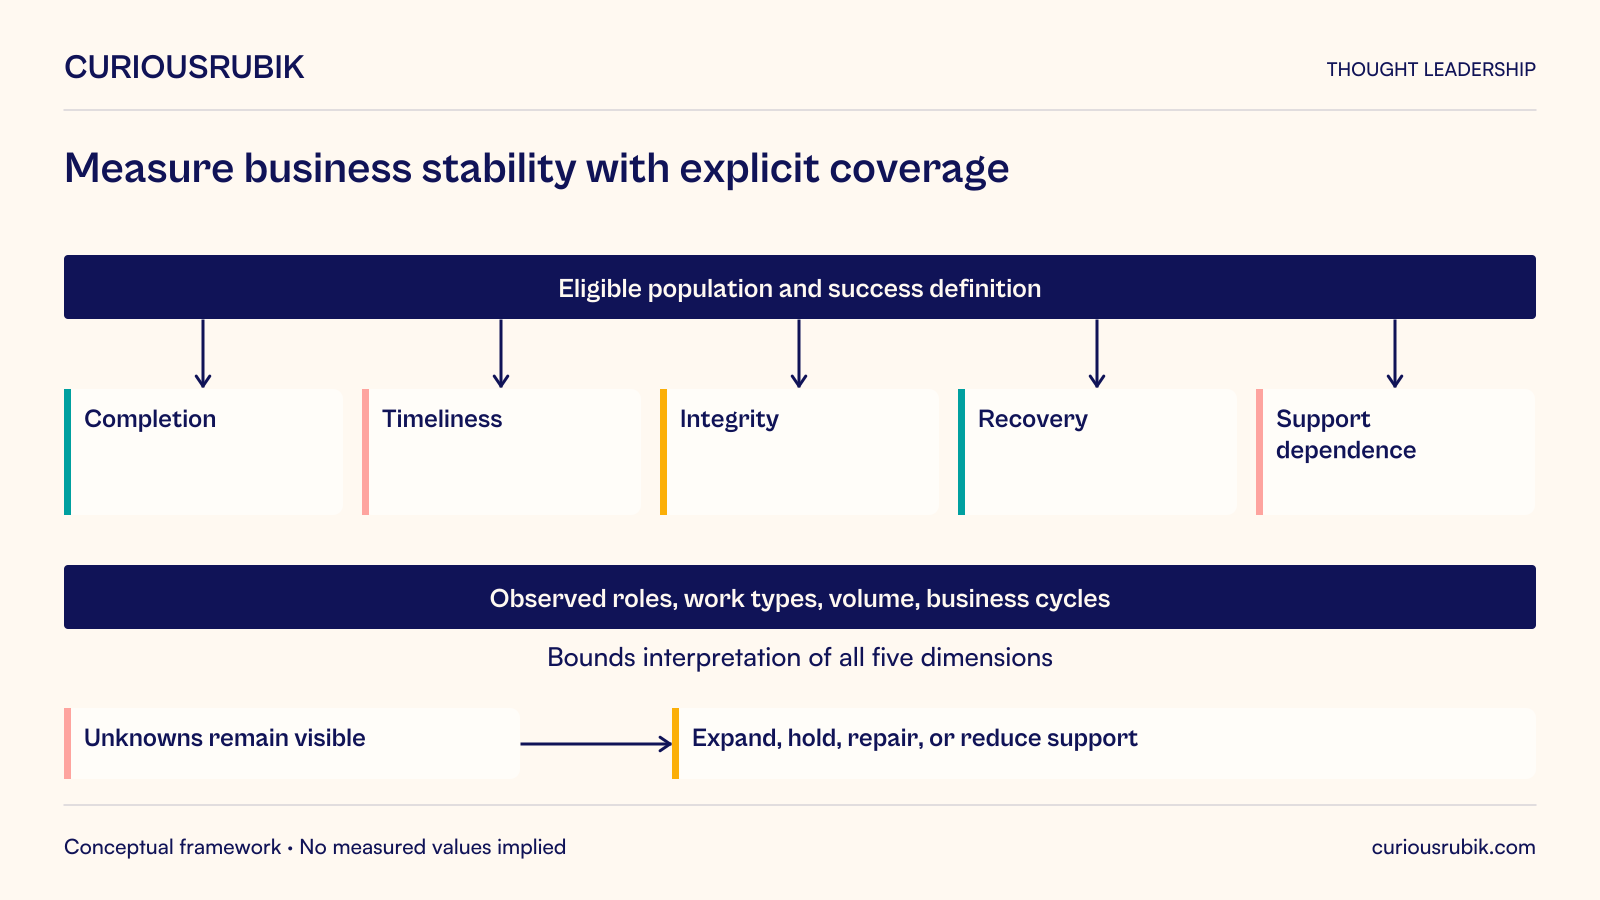
A practical working scorecard covers completion, timeliness, integrity, recovery, and support dependence. This is a proposed management structure, not an industry benchmark.
Completion measures whether eligible business work reaches the required state. Timeliness measures whether it does so within the relevant window, including the experience of slow cases rather than only the average.
Integrity measures reconciliation and correctness at meaningful boundaries. Recovery measures how the team detects, contains, and resolves interruptions. Support dependence records the additional effort and specialist intervention needed to keep the service functioning.
Show coverage beside performance. Identify which roles, transaction types, locations, and business events have been exercised and which remain unobserved. A green score for a narrow population should not imply confidence about a wider release.
Consider a hypothetical company performing condition surveys of commercial buildings. Its new mobile application captures visit records, uploads them when connectivity permits, and makes them available for review in a central system.
Technical monitoring reports that the upload service is available. Users nevertheless report that some completed visits do not appear in the review queue. The first scorecard counted successful network requests, including retries, rather than completed survey records.
The team defines a logical visit record with a stable identifier and reconciles it against the authorized work schedule and device evidence. It distinguishes captured, uploaded, validated, available for review, and approved states. The business owner defines which state and time window matter for the early-life measure.
For a hypothetical example, 2,000 eligible completed visits are due to be available for review within the agreed period. Of those, 1,980 meet the defined conditions and 20 are late or unresolved. The timely-completion rate is 99 percent for that population. It is not an industry target, and it does not establish that the underlying survey judgments are correct.
The team separately records technical retries, validation failures, manual corrections, and the age of unresolved visits. It segments by device type, connectivity condition, and relevant workflow variant to identify where the aggregate result conceals a problem.
A later increase in volume is evaluated as new operating evidence. The company does not assume that a quiet first week proves capacity for a full regional rollout. This hypothetical case illustrates metric definition and coverage, not a measured client result.
Averages can hide a small group of users experiencing severe delay. Where the data supports it, report useful distribution measures or explicit counts of cases beyond business deadlines.
Choose measures operators can interpret. A high percentile can be useful for a high-volume service, while a small set of critical transactions may be better reviewed individually. Avoid displaying a precise percentile from too little data without explaining its instability.
Separate active work from elapsed waiting where possible. A long transaction can reflect a customer decision, a scheduled batch, a technical delay, or a support queue. The service owner needs the reason to choose the right intervention.
Track repeated failures and reopened cases. A ticket closed quickly may recur if the underlying condition remains. Resolution speed alone can reward temporary relief without durable recovery.
Business errors may not generate technical exceptions. A record can be syntactically valid but assigned to the wrong entity, use an incorrect unit, or omit a necessary relationship.
Use reconciliations and targeted sampling at important boundaries. Compare expected source work with downstream results, and investigate unmatched or inconsistent records. Define the owner and consequence of each difference.
Distinguish a known acceptable timing difference from an unexplained discrepancy. A batch that has not yet run should not be treated as a loss, but it should have a clear expected completion point.
Report the age and business effect of unresolved integrity issues. Counting discrepancies without context can make a large number of harmless timing differences look worse than one consequential mismatch.
During early operation, implementation specialists may monitor every batch or repair records directly. Their work should be visible in the stability assessment.
Track manual interventions by cause and role, including time spent reconstructing context, reprocessing, correcting data, or explaining the new workflow. Separate ordinary support from temporary project assistance.
A service can be improving while still depending on concentrated help. That is a valid status if it is stated clearly. It becomes risky when the support is removed because the headline performance measure looked healthy.
Use a controlled reduction in assistance to test sustainability where appropriate. Observe whether ordinary teams can detect and resolve the relevant cases before withdrawing specialist cover from that area.
Early-life trends are difficult to interpret when volume, users, and scope change. A rising incident count may reflect a larger rollout; a falling count may reflect reduced use or a workaround outside the system.
Normalize where useful, but keep absolute impact visible. An error rate can improve while the number of affected customers grows. Both facts may matter to the decision.
Annotate releases, configuration changes, major data corrections, and support changes. Otherwise, the scorecard can suggest a trend without revealing the intervention or changed conditions behind it.
The SRE Workbook’s guidance on implementing objectives emphasizes selecting meaningful service indicators and using objectives to guide decisions. The enterprise lesson is to build a scorecard around actions the owner may take, rather than collecting metrics simply because the platform exposes them. The Site Reliability Workbook, Implementing SLOs.
List the significant events that have occurred during the first month: ordinary daily processing, peak demand, a period close, returns, amendments, or a scheduled recovery exercise as relevant.
For events not yet observed, state the available substitute evidence, such as a rehearsal or scenario test. Do not imply that production performance has been demonstrated when it has not.
Plan targeted coverage for the first later occurrence. This can be more proportionate than retaining the entire launch team until every rare event happens.
Revisit the scorecard when the business cycle changes. The measures useful during initial transaction loading may differ from those needed after the service reaches ordinary volume.
Agree what evidence would justify expanding scope, reducing support, retaining restrictions, or initiating a focused repair. Avoid a universal pass score that lets strong performance in one dimension conceal a critical weakness in another.
Review uncertainty explicitly. Small samples, missing instrumentation, and unresolved data definitions should appear as limitations, not as green cells.
Use a short operational review with the people who can act. The meeting should focus on changes in risk, unresolved business effects, and the next intervention. A lengthy recital of every metric consumes attention without improving control.
Maintain the definitions and history after the first thirty days. The early scorecard should evolve into sustainable service measurement rather than being discarded with the project dashboard.
Ask which business outcomes the metrics prove, which populations they cover, and how retries, unresolved cases, and manual repairs are counted. Ask what important cycle has not yet occurred.
Require the support owner to explain whether the observed performance can be sustained with the planned operating team. Ask the business owner which remaining weakness would change the rollout decision.
Stability is a claim supported by a pattern of dependable operation, meaningful coverage, and manageable recovery. The first month is a valuable opportunity to build that evidence, provided the organization measures the work people need to complete rather than only the behavior its systems find easiest to report.