Operational analytics helps someone decide what to do with work that is still unfolding. Business intelligence helps people understand performance, compare periods, and choose changes to the operating model. They can share source data, but they often need different populations, time boundaries, and acceptance criteria.
For a fulfillment leader and data architect, the design decision is whether one reporting product can serve both the dispatch team’s exception queue and the monthly service-performance review. Sometimes it can, with explicit views and definitions. Often separate products are clearer because the operational team needs current unresolved work while the review needs a stable, explainable cohort.
The distinction is not simply real-time versus batch. A frequently updated management report can still be business intelligence, and an hourly exception list can support an operational decision if it arrives in time. Begin with the action and the meaning of the measure rather than its refresh technology.
An operational product should identify the item requiring attention: an order, shipment, service case, or process exception. It needs the current state, responsible owner, relevant deadline, and information needed to choose the next authorized action.
A business-intelligence product should define the population being compared: orders promised during a period, shipments completed during a period, customers active at a cutoff, or another explicit cohort. It needs consistent definitions, treatment of incomplete cases, and a way to explain changes in the comparison.
These populations can overlap without being identical. A dispatch queue contains unfinished shipments now. A completed-shipment report excludes them until completion. An on-time-performance measure based on promised dates may include them once their deadlines pass. None of these definitions should be hidden behind the same label.
Write separate acceptance questions. Can the dispatcher find the unresolved shipment and act before the next cutoff? Can the review team reproduce the period’s numerator and denominator and explain exceptions? A product can pass one question and fail the other.
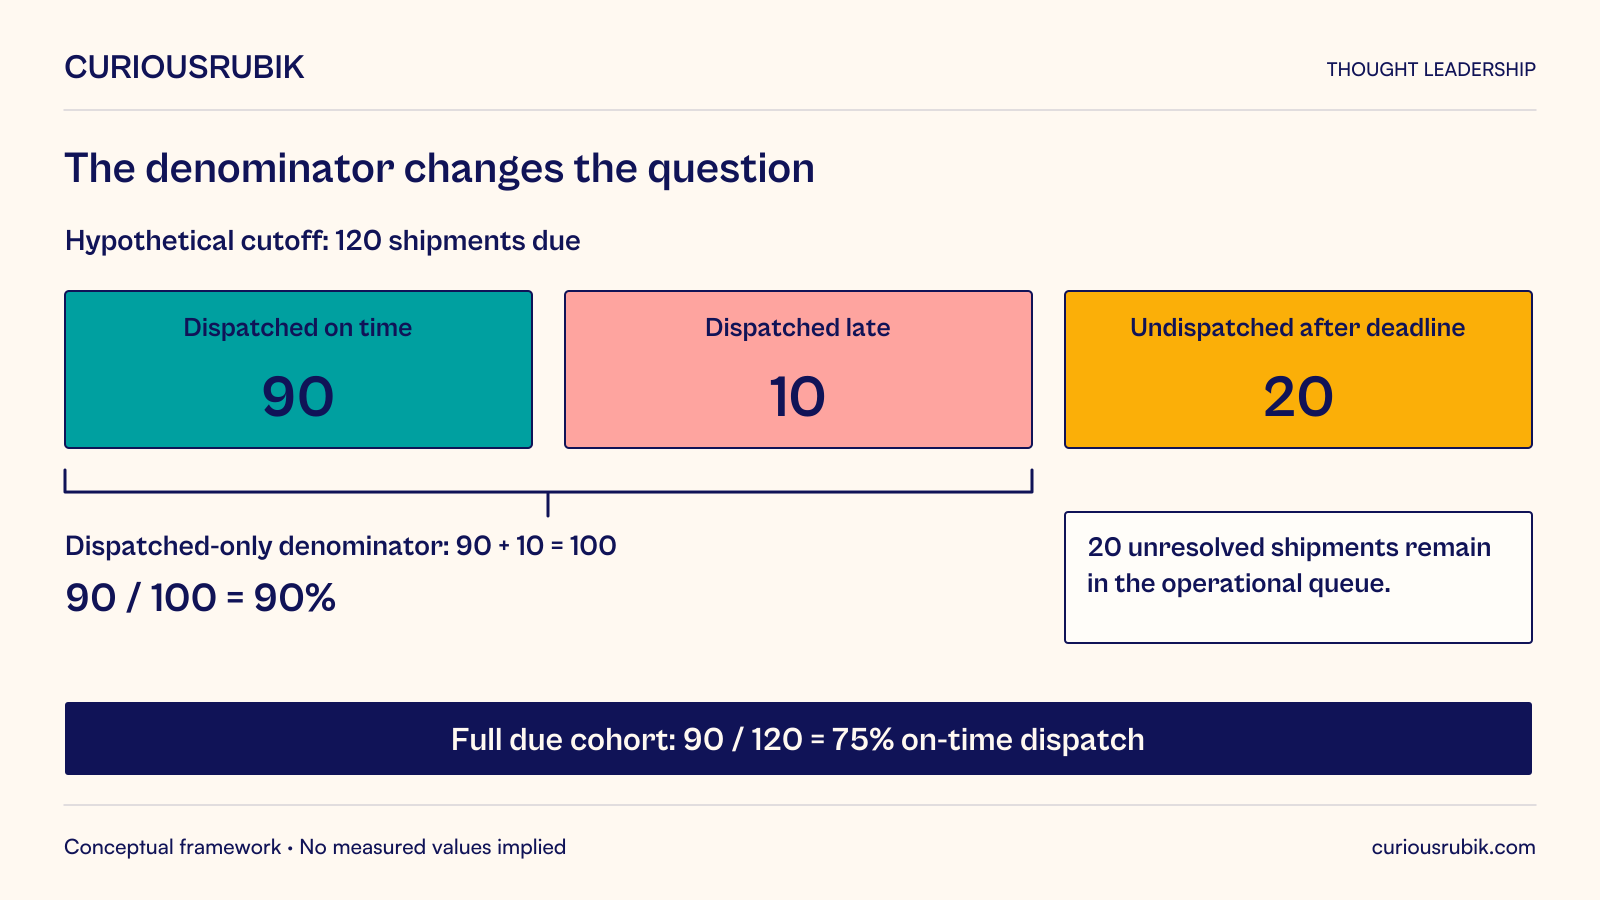
Suppose a hypothetical fulfillment operation has 120 shipments due by the end of a specified day. At the reporting cutoff, 100 have been dispatched: ninety on time and ten late. Twenty remain undispatched and their promised deadlines have passed.
A measure calculated only over dispatched shipments reports ninety on-time shipments divided by one hundred dispatched, or 90 percent. A measure over the full due cohort reports ninety on-time shipments divided by 120 due, or 75 percent. Both calculations are arithmetically correct, but they describe different populations.
The operational queue should make the twenty unresolved shipments visible, with their owners, blocking reasons, and permitted next steps. A monthly review should not accidentally present the 90 percent dispatched-only result as if it covered all commitments due that day. The denominator choice can materially change the interpretation without any source record being wrong.
If some promised dates are disputed or missing, the product needs an explicit exception category. It should not quietly exclude those records to improve the percentage. If the business legitimately changes a commitment, preserve the original and revised dates with the appropriate context so the measure’s policy can be applied consistently.
All quantities and rules in this example are hypothetical. The organization must choose the service definition that matches its actual commitments and reporting purpose. The important design principle is that operational attention and performance comparison require visible population rules.
Operational views often need the latest known state and the age of that state. A dispatcher needs to know whether a shipment is currently blocked, not just that a blockage occurred yesterday. The view should distinguish an active exception from a resolved one and show when the source last confirmed the relevant facts.
Performance analysis often needs business-effective time, processing time, and a controlled reporting cutoff. A dispatch event may occur before midnight but reach the analytical platform the next morning. The team must decide how that late arrival affects the period’s result and how revisions are identified.
Preserve enough event history to reconstruct both questions. A current-state table alone may not reveal whether a shipment was late before a later correction. An event history alone may be inconvenient for an operator who needs one clear current status. Purpose-built projections can serve each use without redefining the underlying event.
Version important metric rules. If the business changes how canceled orders or revised commitments are treated, the comparison needs to identify that change. Otherwise an apparent performance improvement may be a definition change rather than an operational result.
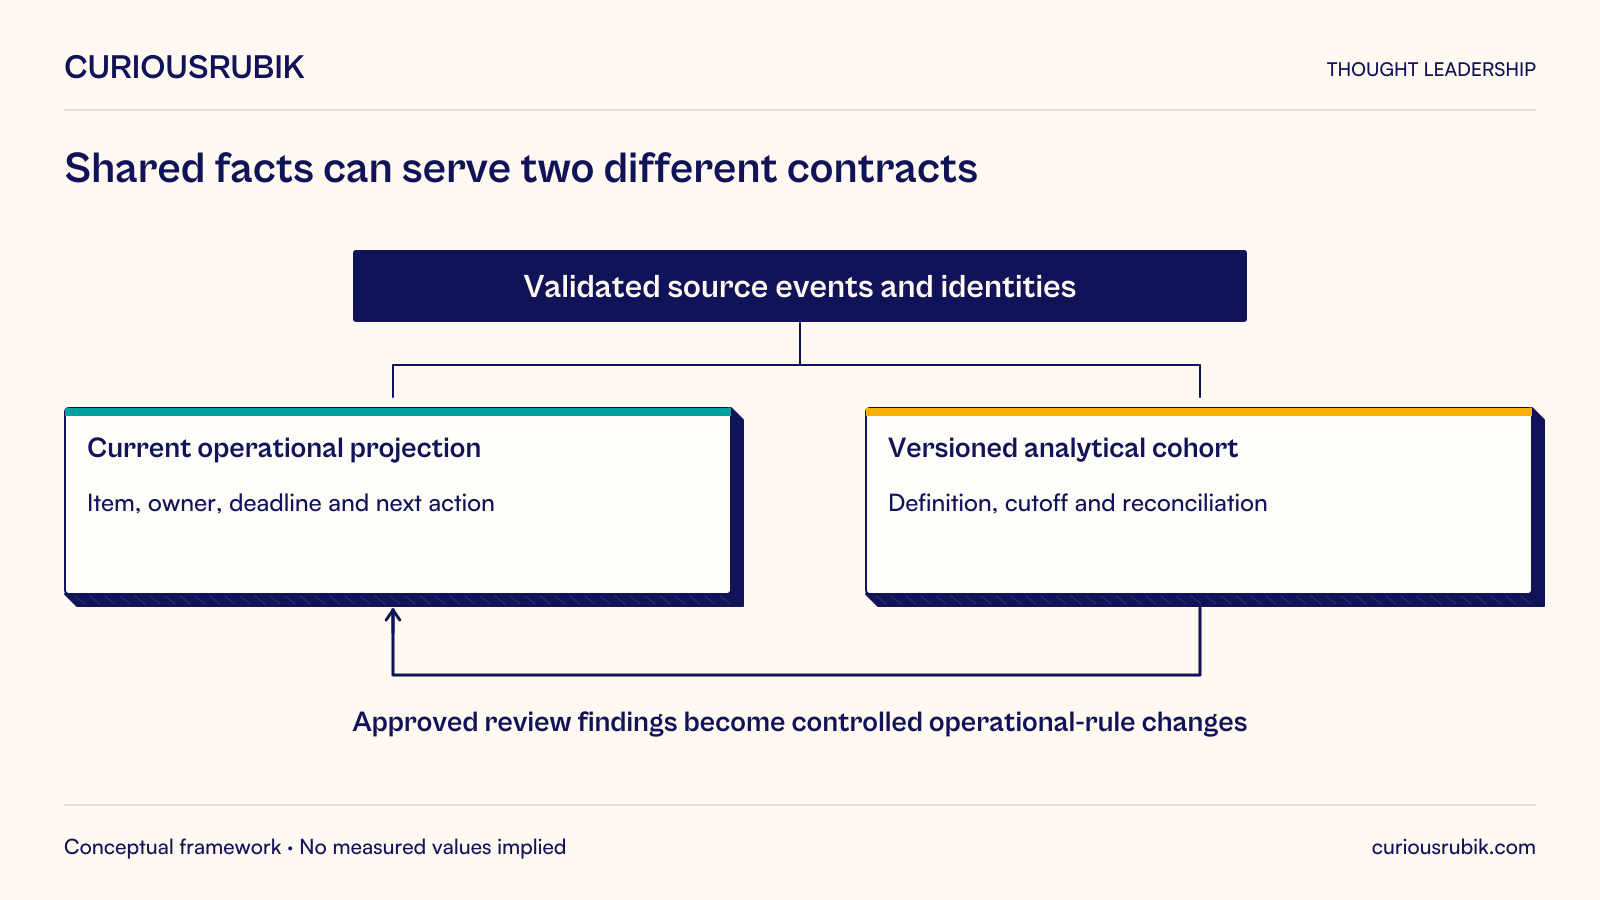
A practical architecture can use common validated source events and identities, then produce a current operational projection and a versioned analytical dataset. The shared layer maintains consistent facts; the serving contracts explain how those facts are selected and interpreted.
The operational projection needs timely updates, clear ownership, duplicate-safe state handling, and a recovery route when it falls behind. It should expose stale or missing sources rather than silently presenting old work as current.
The analytical dataset needs a defined cohort, reproducible transformations, reconciliation to source populations, and an explicit revision policy. A closed period need not be immutable forever, but any correction should create an explainable revised version rather than quietly changing the past.
Google’s SRE guidance emphasizes selecting indicators around user-relevant behavior and notes the importance of end-to-end latency for data pipelines. It provides a useful measurement discipline here, not a prescribed separation between analytics products. Google SRE, Service Level Objectives
Measure each product against its own contract. The operational view’s oldest unresolved update and time to actionable visibility differ from the analytical dataset’s cohort completeness and reproducibility. One platform-health score cannot establish both.
An exception list should include the relevant item, reason, owner, evidence, and available action. If it merely displays a red count, the operator must still search other systems to determine what to do. That delay belongs in the product’s effectiveness assessment.
Keep analytical recommendations separate from transaction authority. A report may identify a shipment as a candidate for expediting, but the action may require approval, current carrier information, or a change to a customer promise. The executing system should enforce the relevant rules.
Record the response to an operational insight where practical. Was the item investigated, deferred, corrected, or resolved? This helps distinguish a useful signal from one that repeatedly consumes attention without changing the outcome.
Avoid making every anomaly an urgent alert. Some conditions require immediate intervention, some belong in a work queue, and others are better examined as a recurring pattern. The classification should follow the decision window and consequence rather than the visual prominence of a metric.
The periodic review should examine patterns that individual operators cannot resolve alone: recurring supplier delays, unrealistic planning assumptions, systematic data gaps, or capacity constraints. Its purpose is to support decisions about policy, resources, and process design.
Separate descriptive patterns from causal claims. If one location has worse on-time performance, investigate differences in workload, promise mix, recording practices, and constraints before attributing the result to local execution. A comparison can identify a question without proving its explanation.
Connect approved changes back to operational products. If a review changes the exception threshold or the definition of a blocking condition, update the work queue’s rules through a controlled process. Otherwise the organization can agree on an improvement while frontline users continue to act under the old logic.
Retain a decision record with the intended effect and review point. The next period should examine whether the change was implemented and what happened, including unintended effects. Business intelligence becomes more useful when it closes this loop rather than producing a new narrative every month.
One product may be sufficient when the users share a population, timing requirement, and definition, and the interface can present both item-level work and aggregate comparison clearly. Separate products may be better when operational updates would continually revise the management baseline or when a stable report would hide current exceptions.
Separate products do not justify duplicated definitions. Share authoritative identities, relevant source facts, and common calculations where their meaning is genuinely the same. Document differences where the purpose requires them, such as dispatched-only versus due-cohort performance.
There are costs to maintaining two serving models: additional tests, documentation, reconciliation, and support. Compare those costs with the confusion and risk of forcing incompatible questions into one dashboard. The right design is the simplest one that preserves meaning and supports both decisions reliably.
Test the relationship between the two products with named example records. A shipment that is unresolved at the daily cutoff should remain visible in the operational queue and receive the correct treatment in the due cohort. When it is later dispatched, the queue should resolve it without rewriting the fact that its original deadline was missed. This cross-product test catches semantic drift that separate dashboard tests can overlook.
Start with one operational queue and one management metric that appear to describe the same process. Write their populations, time boundaries, unresolved-case treatment, and actions side by side. Reconcile the differences before selecting technology. Leaders need current evidence to run today’s work and stable evidence to improve tomorrow’s system, with a clear connection between the two.