A business can grow while making each sale harder to deliver. Strong demand, a price increase or a few large contracts can lift revenue even as quotations require more exceptions, customer commitments become less clear and delivery teams spend more time repairing what was sold. The revenue result is real. It simply does not tell management whether the process producing it is becoming more dependable.
For a chief revenue officer deciding whether to add sales capacity, that distinction matters. Hiring more sellers into a process with unresolved pricing, approval and handoff problems can increase the volume of exceptions faster than the organization can absorb them. Before scaling, examine how the latest growth was created and what burden followed it into operations.
The useful question is not whether growth is good. It is whether the business can repeat that growth at an acceptable contribution, service level and management workload. That requires tracing selected deals beyond the sales dashboard.
Revenue is an outcome affected by several mechanisms. A team can sell more units, sell at higher prices, shift toward a different product mix or inherit revenue through an acquisition. A comparison of total revenue between periods cannot, by itself, distinguish those effects from better execution.
Begin with the definition of the reported number. Bookings, invoiced sales, recognized revenue and cash receipts describe different events. The finance team should define each measure and its timing for the business. For example, IFRS 15 bases revenue recognition on satisfying performance obligations through the transfer of promised goods or services; a CRM status alone does not establish that condition. This article is about operational diagnosis, not determining accounting treatment. IFRS Foundation overview of IFRS 15.
Next, reconcile the sales story to the operational story. If management attributes growth to faster selling, look for shorter elapsed time in comparable opportunities, not just a smaller average caused by a changing mix. If the claim is better pricing, examine realized commercial terms and later concessions, not only the initial quote. If the claim is stronger account development, distinguish repeatable expansion from a single customer event.
This is not an argument for perfect attribution before making decisions. It is a way to avoid rewarding a mechanism that the available evidence has not established.
A sales process can appear fast because it transfers unresolved decisions to another team. A seller marks an opportunity as won before a service start date is confirmed. A quotation includes a nonstandard reporting commitment without identifying who will produce it. A contract assumes a customer will provide clean source data, but no one establishes what clean means.
Those decisions do not disappear at signature. They reappear as delivery rescheduling, customer disputes, support requests or senior-management escalation. The sales team’s cycle time improves while the company’s end-to-end cycle becomes more fragile.
Follow the commitment itself. What exactly was promised? Who accepted responsibility for fulfilling it? What evidence demonstrates that the receiving team could act without rediscovering the agreement? A handoff is complete when the next owner can begin the correct work, rather than when a notification was sent.
That distinction gives sales leadership a constructive way to discuss friction. The issue is not whether a seller filled every field. It is whether a material promise reached the people who must honor it, in a form they could use.
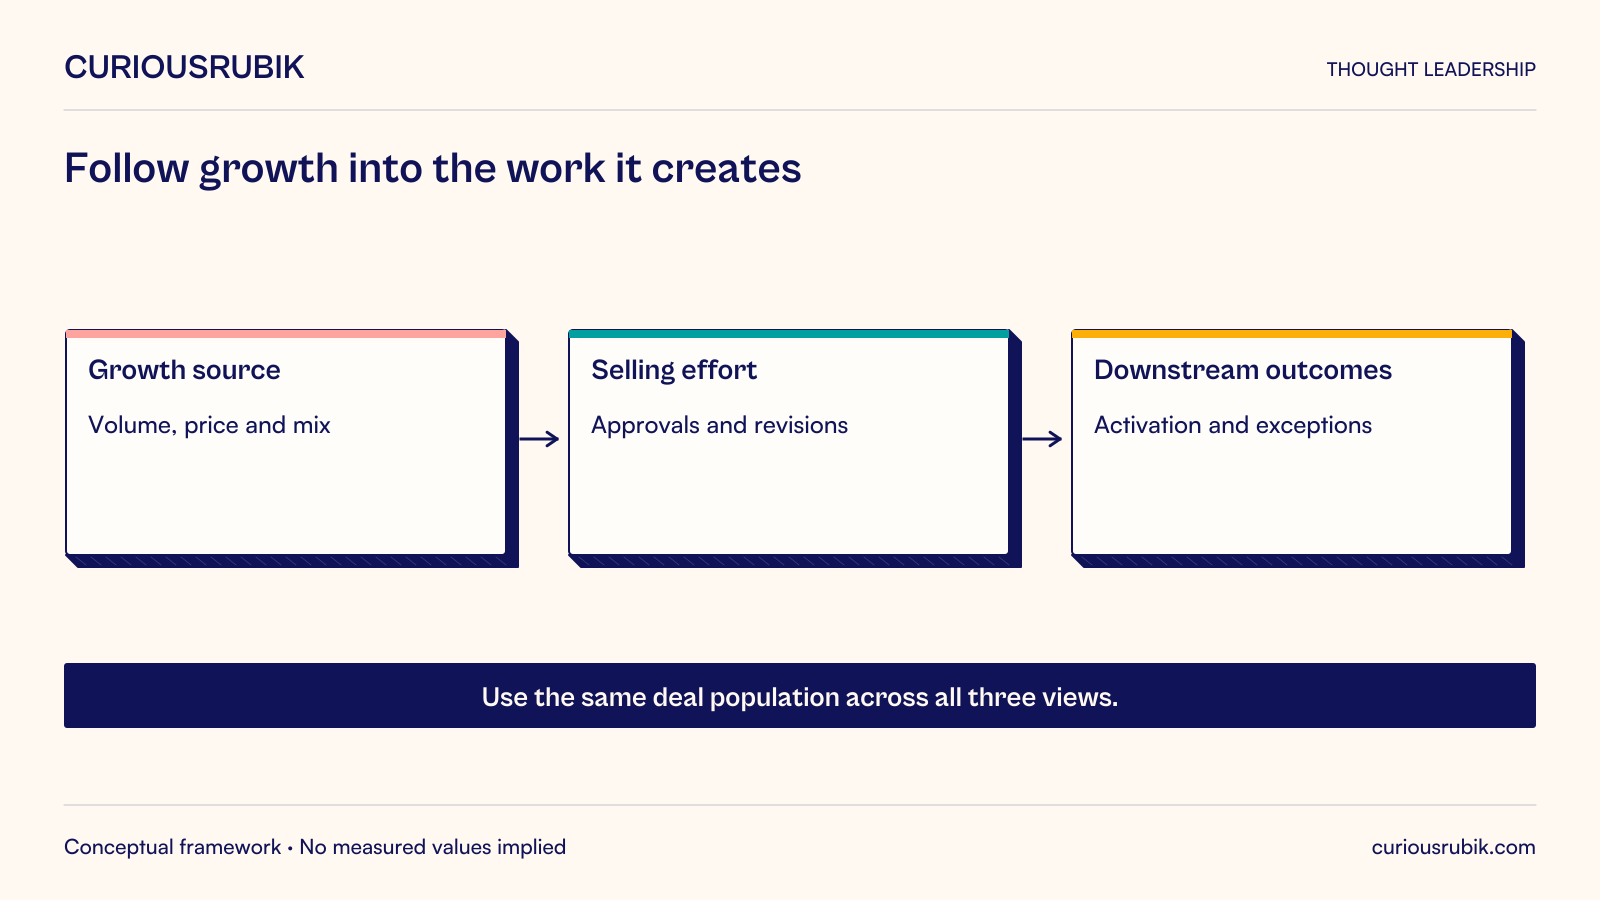
Use three linked questions as a working diagnostic, not a validated scoring model: where did growth come from, what did it require, and what happened afterward? Each question should use the same deal population wherever possible.
Where did growth come from? Divide the population into commercially meaningful groups, such as new versus existing customers, standard versus negotiated offerings, and established versus new markets. Keep the groups few enough that teams can interpret them. A tiny segment should not support a sweeping conclusion.
What did it require? Examine sales and supporting effort: approval loops, quotation revisions, technical presales work and management exceptions. Time records may be incomplete. Start with a defensible sample and label the limits rather than claiming an exact company-wide cost.
What happened afterward? Follow activation, acceptance, billing readiness, service exceptions and early commercial adjustments. Choose outcomes appropriate to the offering. A manufacturer may inspect promised versus achievable delivery dates; a professional-services firm may examine the difference between contracted scope and the delivery plan.
The three questions belong together. A segment can be attractive despite high selling effort if its economics and delivery are strong. Another can look efficient in the pipeline but create repeated disputes after signature. The aim is to understand a tradeoff, not to declare every exception a failure.
Consider a hypothetical maintenance company with two comparable annual cohorts of newly signed service contracts. The example uses invented figures to show the diagnostic; it is not a client case or a market benchmark. In the first cohort, 100 contracts have a combined annual contract value of $1 million. In the second, 120 contracts have a combined annual contract value of $1.32 million. Contract value has increased by 32%, reflecting both more contracts and a higher average value.
The company should not call that 32% recognized revenue growth without the appropriate finance reconciliation. For this exercise, annual contract value is simply the sum of the specified first-year contracted amounts, excluding optional renewals and taxes.
In the first cohort, 10 contracts need an operational exception before service can start. In the second, 36 do. The exception share has moved from 10% to 30%. That does not prove the growth strategy is wrong. Perhaps the second cohort contains larger, more complex sites with better long-term economics. It does establish a question that the headline value cannot answer.
The team reviews the 36 exceptions and discovers three distinct causes: proposed response times that lack local staffing coverage, asset lists that differ from quotation assumptions, and customer reporting formats requiring manual preparation. Treating all three as a generic “handoff problem” would produce an unfocused training program.
Instead, sales and operations agree different interventions. Response-time commitments require coverage confirmation before proposal approval. Asset-list uncertainty needs a survey or an explicitly governed assumption before final pricing. Reporting variations need either a priced service, a standard alternative or a named owner who accepts the continuing effort.
Management then compares the next comparable cohort with the earlier one. It watches exception frequency, time to service activation and contribution under its established costing method. It also watches lost deals and proposal delays. If the new controls prevent profitable, manageable business, they need adjustment. A process improvement must preserve commercial judgment rather than merely suppress variation.
Begin with a limited, jointly reviewed sample. Select deals across the relevant segments, including ordinary wins, troubled wins and losses. Reviewing only failures creates a distorted picture; reviewing only the largest wins hides everyday friction.
For each deal, reconstruct a short timeline from the first meaningful qualification through the first usable delivery handoff. Record dates and evidence for major commitments. Distinguish time spent doing necessary work from time spent waiting for a decision or repairing incomplete information.
Ask employees to explain exceptions before assigning categories. A repeated escalation might indicate unclear authority, but it might also be a deliberate safeguard for unusual risk. The process owner should establish which explanation is supported by records and which remains an interpretation.
Use the findings to change a decision or remove unnecessary work. If the exercise only produces another dashboard or individual ranking, employees have little reason to improve its data. Give them a visible return: clearer approval authority, fewer duplicate requests or a quicker route for genuine exceptions.
Restrict access to deal details according to business need, and avoid collecting personal information unrelated to the diagnostic. The objective is to understand the operating process, not infer motives from activity logs.
After the review, place each observed issue into one of four actions. First, preserve variation that creates customer value and can be delivered economically. A complex deal may deserve a different route rather than forced standardization.
Second, simplify variation that exists because teams use different labels or documents for the same thing. A common definition of a ready-to-start service can remove repeated clarification without limiting the offer.
Third, constrain promises that exceed known capacity or control boundaries. The constraint should name the approving authority and required evidence. “Seek approval when necessary” leaves the uncertainty intact.
Fourth, investigate issues for which the evidence is insufficient. An apparent margin problem may reflect a costing allocation rather than a poor sale. An activation delay may be caused by a customer’s requested schedule. Do not redesign the commercial process around an untested explanation.
These choices require sales, finance and delivery ownership. A sales-operations analyst can assemble the evidence, but cannot alone decide which commitments the company should accept or what economic tradeoffs it will tolerate.
A lower exception rate can result from better qualification, but it can also result from employees failing to record exceptions. A faster handoff can reflect better information, but it can also reflect premature acceptance. Pair a process metric with an outcome that would expose that behavior.
For instance, assess handoff completeness alongside the receiving team’s need to reopen the record. Assess proposal turnaround alongside correction frequency. Assess standard-offer adoption alongside lost-deal explanations and delivery performance. Do not create a large scorecard merely to cover every possibility; choose measures that test the specific change being made.
Interpret trends with the size and composition of the population visible. A handful of contracts can move a percentage substantially. Report counts as well as rates, and keep definitions stable long enough to compare results. Where definitions change, explain the break rather than presenting a continuous trend.
Revenue growth deserves attention and celebration. It also provides the resources and urgency to strengthen the process before hidden obligations become operating constraints. Before adding the next wave of sellers, trace a representative set of recent wins into delivery and identify one recurring commitment that should be made clearer, priced differently or accepted by a different owner. That is a more useful starting point than assuming the growth chart has already validated the sales system.