
Defining the Numbers on Your ERP Dashboard. Agree what each measure counts and how to check it.
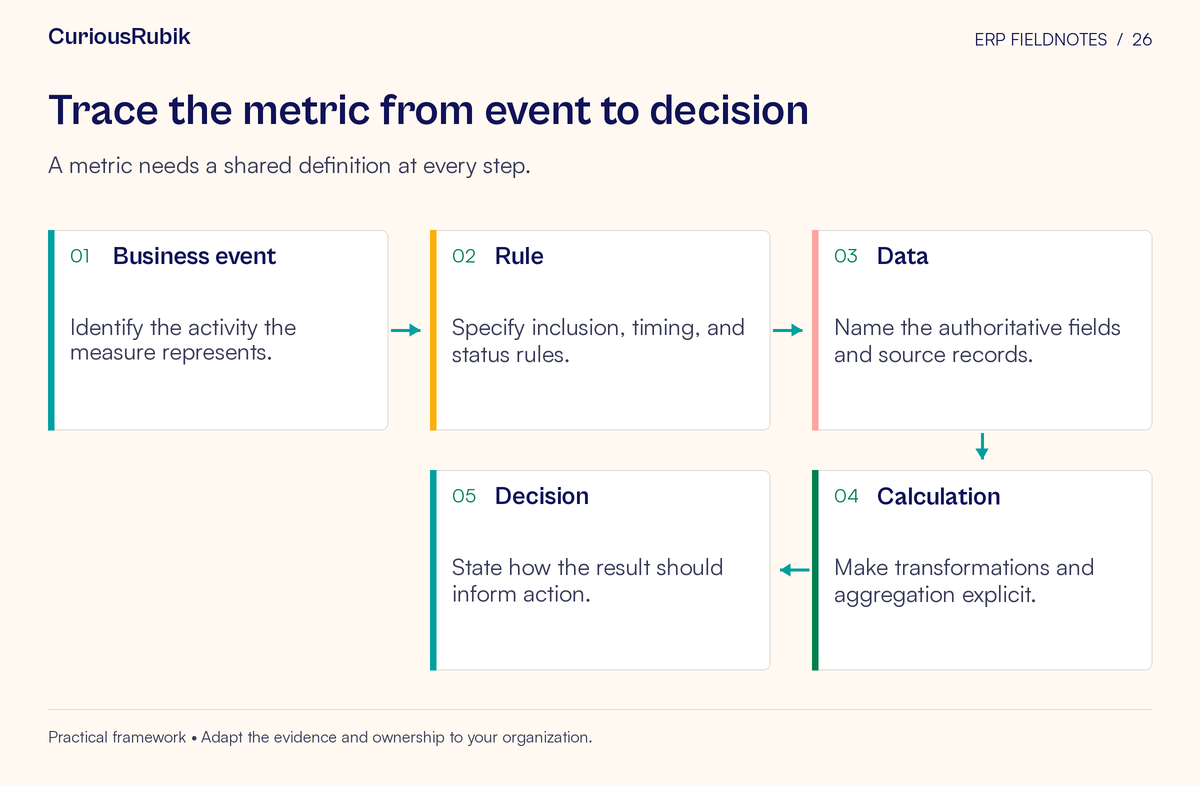
Define the business meaning of an ERP metric before deciding how to display it. Specify what is counted, at what level, for which period, with which exclusions, and for whose decision. Then connect the calculation to the operational events that produce its data.
A dashboard can present one number consistently while different teams attach incompatible meanings to it. A metric dictionary makes those differences reviewable before they become a reporting dispute or an incentive to change the wrong behavior.
Start with a consequential metric, such as on-time fulfillment, overdue receivables, available inventory, or purchase-price variance. The goal is a definition that a process owner, analyst, and report user can apply to the same transactions and reach the same result.
A small example of a large ambiguity
Imagine a hypothetical business reviewing on-time dispatch for three orders. Order A has two lines, both dispatched on time. Order B has two lines, one on time and one late. Order C has one line, dispatched on time.
Four of five lines were on time, producing an 80% line-based result. Two of three orders were completely on time, producing approximately 66.7% on an order-complete basis. Both calculations can be correct under their stated definitions. They answer different questions.
A dashboard labeled only “on-time dispatch” leaves the reader to guess which question it answers. Adding a common charting tool or a more frequent refresh does not resolve that ambiguity.
The example uses invented transactions solely to illustrate measurement. In a real definition, the team would also need to decide which promised date is used, how split dispatches count, and what happens to canceled or partially fulfilled lines.
Start with the decision the number supports
Write the decision before the formula. “Identify where warehouse execution is missing agreed dispatch commitments” leads to a different metric from “estimate the customer experience of receiving a complete order.”
Record who acts on the result, the action they can take, and when the information is useful. A daily operating measure may need incomplete transactions visible. A monthly comparison may require a stable closed-period population. Neither design is automatically better.
Also name the counter-question. If the team improves dispatch timeliness by splitting orders into many small shipments, what else should the decision maker inspect? Depending on the business, that may include complete-order service, shipping cost, or customer complaints. A counter-metric helps reveal whether the apparent improvement moves the burden elsewhere.
Avoid including a measure simply because the ERP contains a convenient field. First establish the decision, then determine whether the available data can support it credibly.
Complete a metric-definition card
Use one card for each metric that informs an important decision.
- Metric name, identifier, and definition version: ______
- Business decision and accountable owner: ______
- Numerator and denominator, where applicable: ______
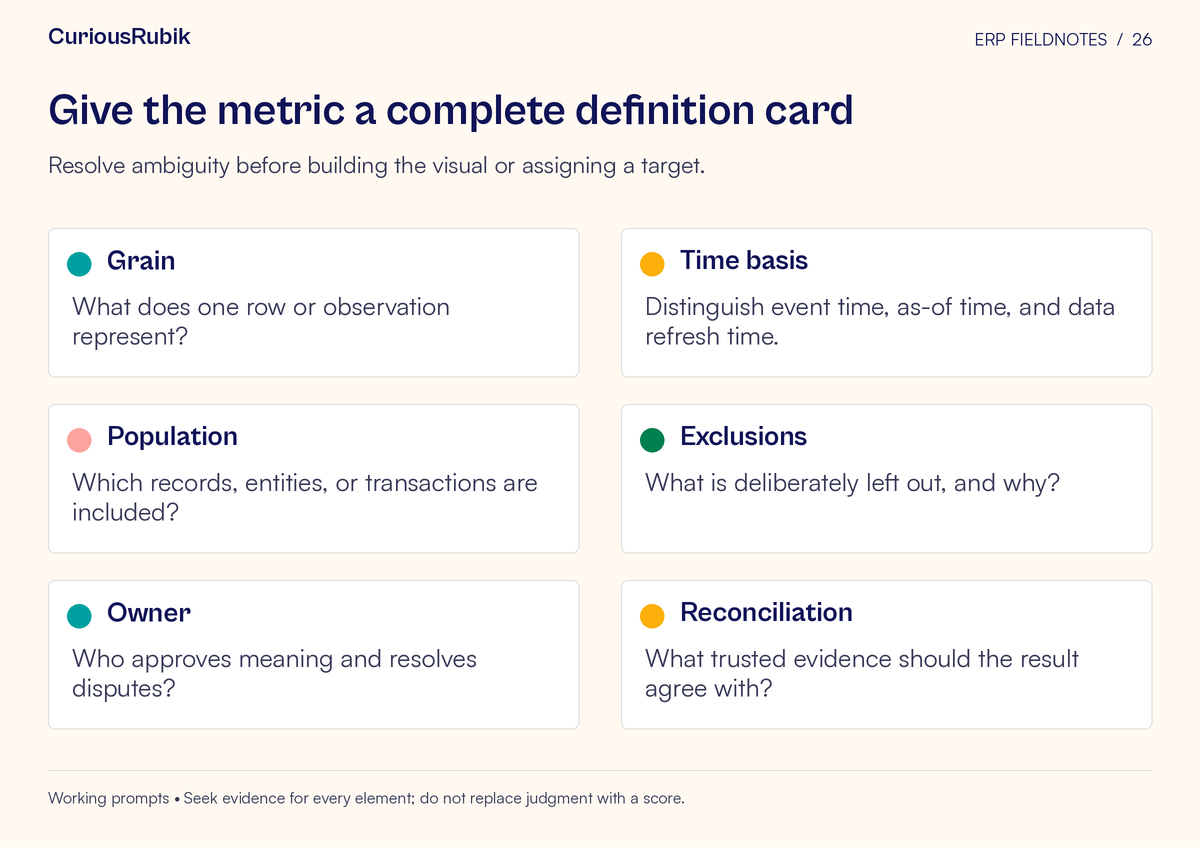
- Grain, meaning the unit represented by one measurement record: ______
- Included entities, sites, customers, products, and transaction types: ______
- Business event and date used to assign the reporting period: ______
- Time zone, calendar, and cutoff convention: ______
- Inclusion rules, exclusions, cancellations, and reversals: ______
- Handling of missing values, duplicate records, and zero denominators: ______
- Source fields, joins, transformations, and record identifiers: ______
- Treatment of late events and corrections: ______
- Aggregation rules across teams, periods, and hierarchies: ______
- Refresh timing, completeness indicator, and permitted uses: ______
- Reconciliation method, approval evidence, and change owner: ______
A useful card can be read without examining the code. The calculation logic should then implement the approved meaning precisely. Keep both connected through the definition version and a stable metric identifier.
Be explicit about grain and population
Grain is the level at which a record becomes one observation: an order, order line, shipment, invoice, invoice line, customer-day, or another defined unit. Establish it before joining data from several sources.
For example, one order line may have several shipment records. Joining them can create several rows for the same line. A calculation that counts rows after the join may unintentionally change from a line-based measure to something else.
Write the expected relationship between the data sets and test representative cases with multiple matches. Record how the calculation avoids duplication or deliberately allocates a value across records. A matching overall total is not enough to prove the logic is correct.
Define the population with equal care. Does on-time performance include internal transfers, samples, canceled orders, or orders still open at the reporting cutoff? An exclusion may be reasonable, but it changes what the result means. Make exclusions visible and, where useful, report the excluded population alongside the headline measure.
Separate the clocks in the definition
At least three times may matter.
Event time is when the business event occurred or became effective under the agreed rule. As-of time is the point at which the report describes the business state. Refresh time is when the reporting data was updated.
A report refreshed this morning may still omit events that have not arrived from a source system. Displaying the refresh time alone can give a false impression of completeness. Define the evidence used to determine whether all expected data through the relevant cutoff has been processed.
For a service metric, also establish which commitment date applies. The original promised date measures one question. A revised agreed date measures another. If users can overwrite the only stored date, the business may lose the ability to distinguish the two.
This can create an ERP process requirement: preserve the necessary event and change history. A reporting team cannot reliably reconstruct an unstored decision merely by adding another calculation.
Decide how history changes
Late-arriving events and corrections require an explicit policy. Will the metric restate prior periods, preserve the originally published value, or provide both a closed snapshot and a current view? Each choice has a use.
A current operational view may need the latest corrected state. A management review may need to reproduce the number that informed an earlier decision. A regulated or financial report may have additional requirements that the responsible specialists must determine.
Record the policy in the definition and label the resulting views. Do not silently mix a frozen denominator with a newly updated numerator. When a material correction changes a published number, give users enough explanation to understand the effect.
Organizational changes create a related question. If a site moves between regions, should historical results follow the old structure or be restated under the new one? Preserve the required hierarchy basis and effective dates. “By region” is incomplete until that choice is clear.
Reconcile populations before arguing about totals
When two departments report different values, begin with the underlying records and definitions. Select a bounded period and produce a comparison using stable business identifiers.
Classify differences into practical groups:
- Records included by one definition and excluded by the other
- The same record assigned to different periods or organizational groups
- Different event or commitment dates used for the same record
- Different treatment of partial completion, reversal, or cancellation
- Duplicates introduced by transformation or joining
- Missing or late source data
- Different aggregation or rounding rules
This classification turns “the dashboard is wrong” into work that an owner can resolve. The departments may need one shared metric, two clearly named metrics, or a repaired calculation. Agreement does not require erasing a legitimate difference in purpose.
In the hypothetical dispatch example, the discrepancy is primarily grain and success condition. The team could retain both “order-line on-time dispatch” and “complete-order on-time dispatch,” explain their relationship, and use each for its intended decision.
Test the definition with awkward records
Before building the final dashboard, create a small reference set with expected results approved by the metric owner. Include ordinary records and the cases most likely to expose ambiguity.
For dispatch timeliness, test a split shipment, a canceled remainder, a changed promise date, a missing timestamp, a return, and an event received after the reporting cutoff. Test a period with no eligible transactions and decide how the display should represent an undefined rate.
Check aggregation separately. Combining regional percentages generally requires attention to their denominators; averaging percentages without that context can answer a different question. A stock balance is also different from a flow across a period, so define whether an inventory measure is a point-in-time balance, an average of snapshots, or another specified quantity.
Keep the expected results with the metric version. They become regression tests when a source, mapping, hierarchy, or calculation changes.
Give the metric more than a technical owner
Assign the business owner authority over meaning and permitted use. Assign the data owner responsibility for source-event quality. Assign a technical owner responsibility for implementing and monitoring the calculation. Identify who approves changes that affect comparisons or decisions.
One person may hold several roles, but the responsibilities should remain clear. An analyst should not have to decide an unresolved business-policy question simply to finish a dashboard.
Require a change note when the definition changes materially. State why it changed, which reports use it, the effective date, whether historical values were recalculated, and what users should stop comparing. Coordinate release of the definition, calculation, test evidence, and dashboard label.
Publish enough context for the reader
The dashboard does not need to display the entire dictionary. It should expose the metric’s meaningful name, reporting period, relevant as-of or completeness information, and a route to the approved definition. Warn users when a known data issue changes how the number can be used.
Before release, ask a report user to explain the metric in their own words and trace one unusual transaction into the result. If the answer differs from the owner’s intent, improve the definition or presentation.
A useful first deliverable is one completed card and one reconciled reference set. Once the business can explain what the number means and reproduce it, the dashboard has a sound basis for the decision it is meant to support.