Mobile applications improve operational visibility when they capture trustworthy evidence close to the work and make its age, coverage, and meaning clear to the person deciding what happens next. Faster reporting helps only if the receiving manager can distinguish work completed from work reported, and a current observation from a stale or missing one.
For an operations leader funding a live dashboard, the central decision is which mobile events justify an operational intervention. A map of devices or a stream of status updates may look informative while leaving the real question unanswered: which job needs attention, why, and who can act?
The recommended starting point is a small set of decision-linked events with explicit definitions and accountable responses. This article uses a hypothetical retail promotional-display rollout to show how freshness and incomplete reporting affect a manager’s interpretation. It does not claim measured results from a retail implementation.
Work backward from an intervention
Identify a decision the manager can make during the operating window. A regional retail manager might send missing display materials, arrange a merchandising check, or delay location-specific advertising until installation is verified. Each action requires different evidence. An app should capture information that makes those actions more reliable rather than collect every movement that a device can report.
For each decision, define the triggering event, the necessary context, how recent it must be, and the responsible responder. “Display installed” can trigger a merchandising check. “Promotion verified” can inform campaign planning. “Materials missing” can require a replenishment decision. Combining these into a generic completed status hides the distinction between installation activity and campaign readiness.
Decide which information should remain outside the dashboard. Continuous location may be unnecessary when a task-level status provides the required evidence. Excessive collection increases privacy and governance obligations, and may undermine the trust needed for accurate reporting. Evaluate collection with the appropriate privacy, workforce, and legal owners for the actual jurisdiction and employment context.
A useful visibility investment therefore begins with a decision inventory. If nobody can explain what action a metric changes, question whether it belongs in the first release. Visibility has operating costs: entry effort, data processing, interpretation, and attention.
Give every event a stable meaning
Define an event as a specific observation or business transition. Record the relevant work identifier, event type, actor or authorized role, and enough context to interpret it. Avoid free-text status fields whose meaning changes from team to team.
Separate reported facts from inferred states. An employee’s “task finished” submission is a report. An authorized merchandiser’s verification is a different event. A dashboard may infer that a store is launch-ready only after the campaign’s defined conditions are met. That inference should be visible and testable, not concealed in a colored tile.
Establish correction behavior. If an employee reports the wrong store, the correction should preserve traceability and update the current view. Simply deleting an earlier event can make later decisions difficult to explain. The detailed retention design should fit the organization’s obligations and need for accountability.
Define the aggregation boundary too. Does the dashboard count tasks, stores, visits, employees, or orders? A store may have several display tasks. Counting installed displays as launch-ready stores can overstate campaign coverage even when every underlying event is accurate.
A hypothetical regional promotion rollout
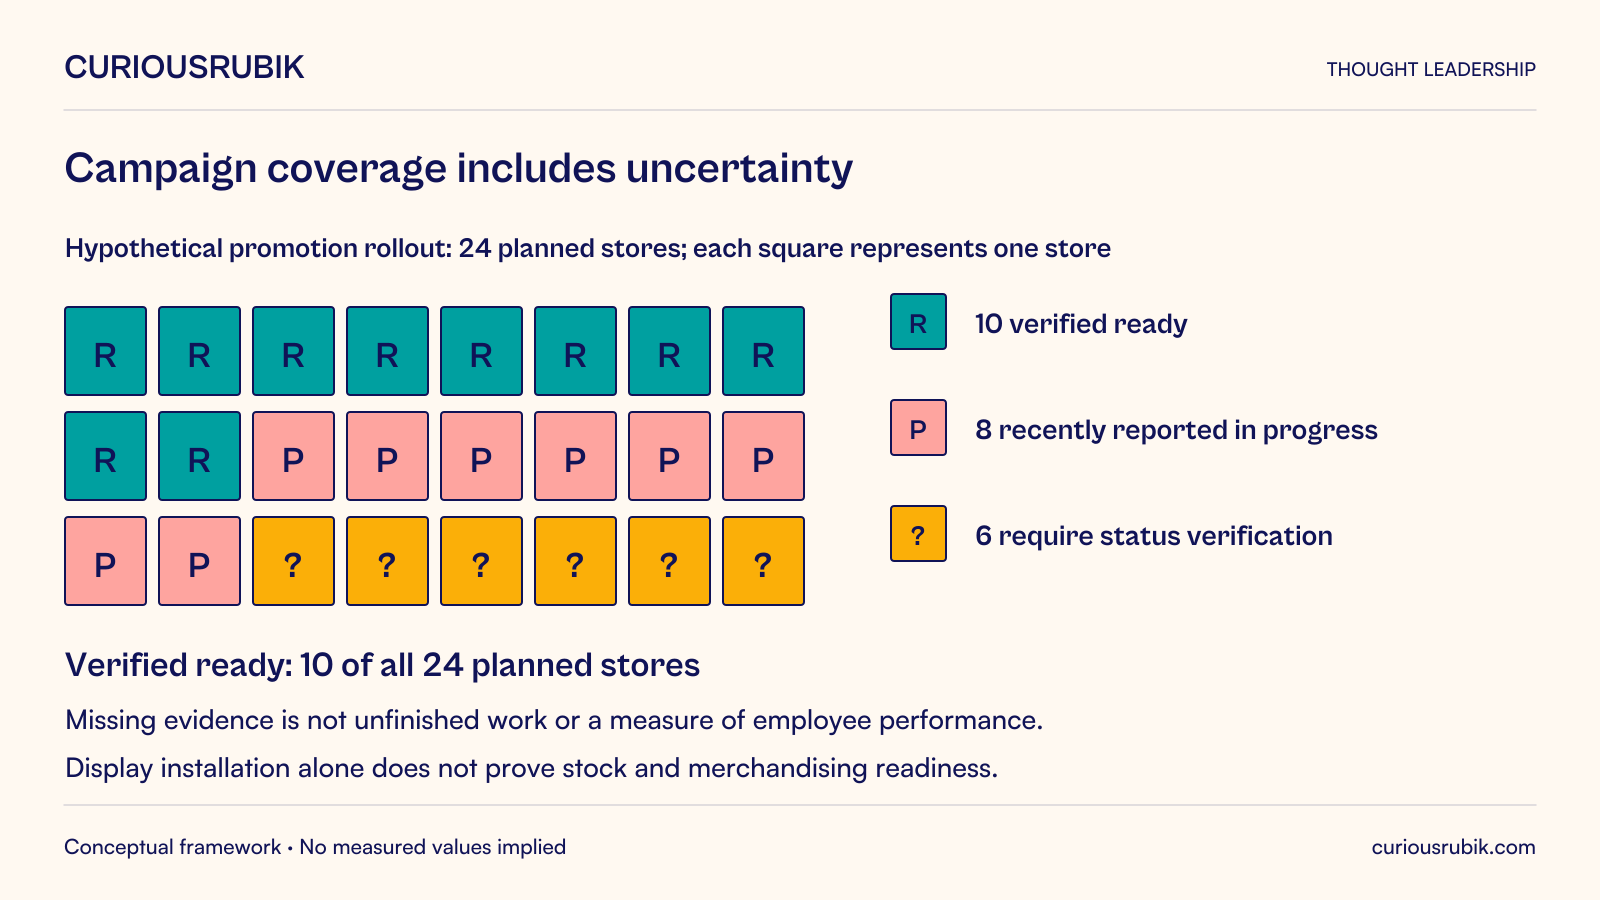
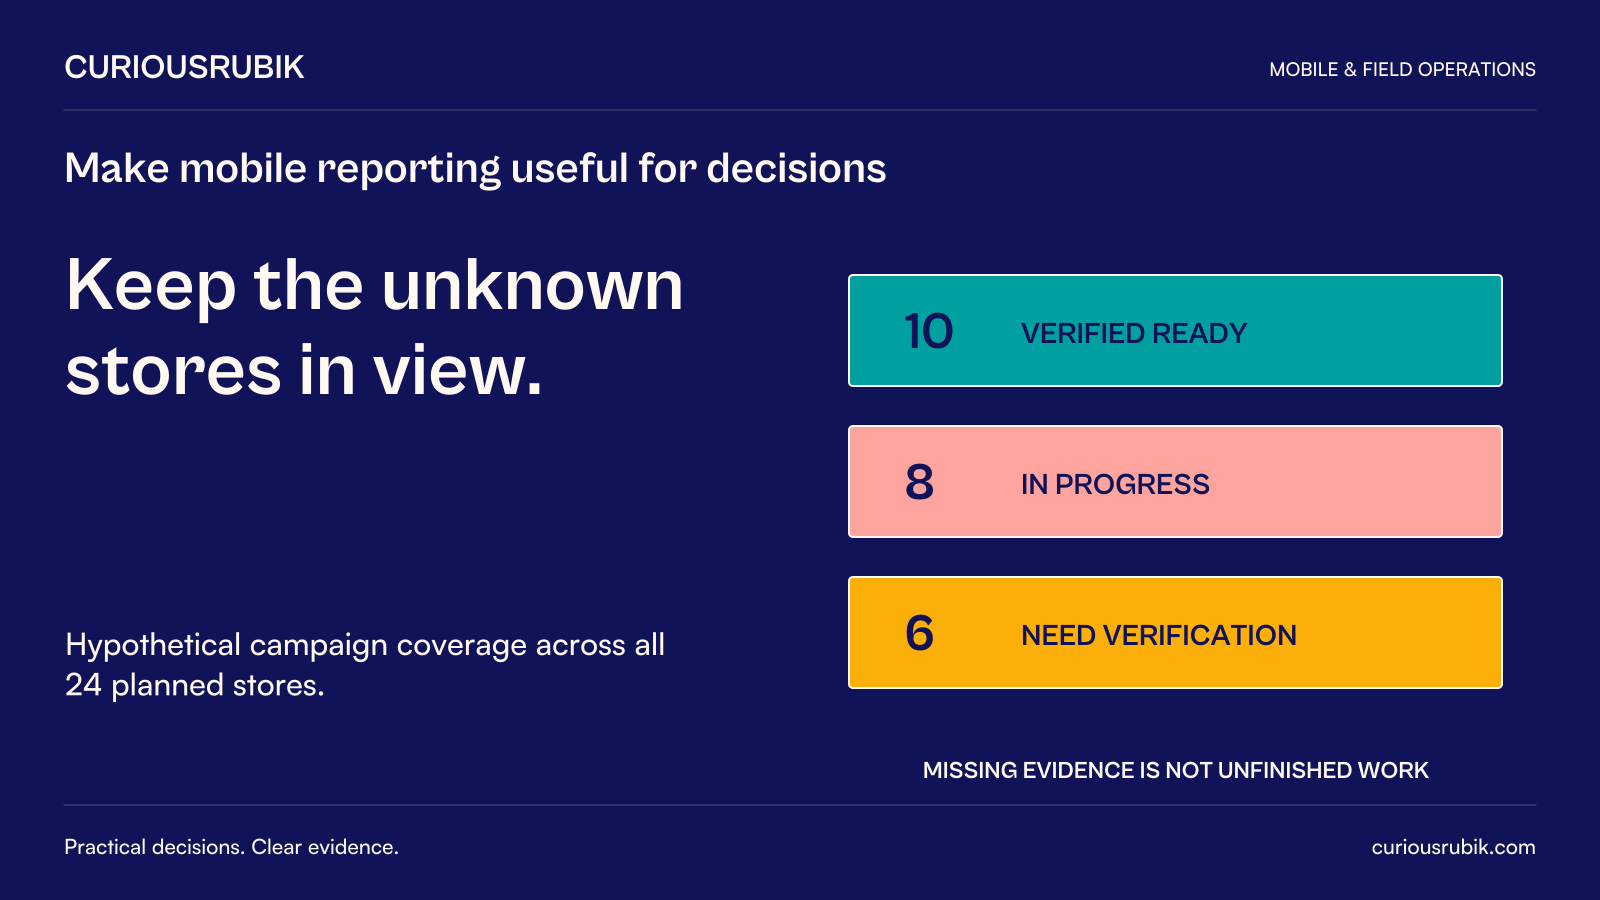
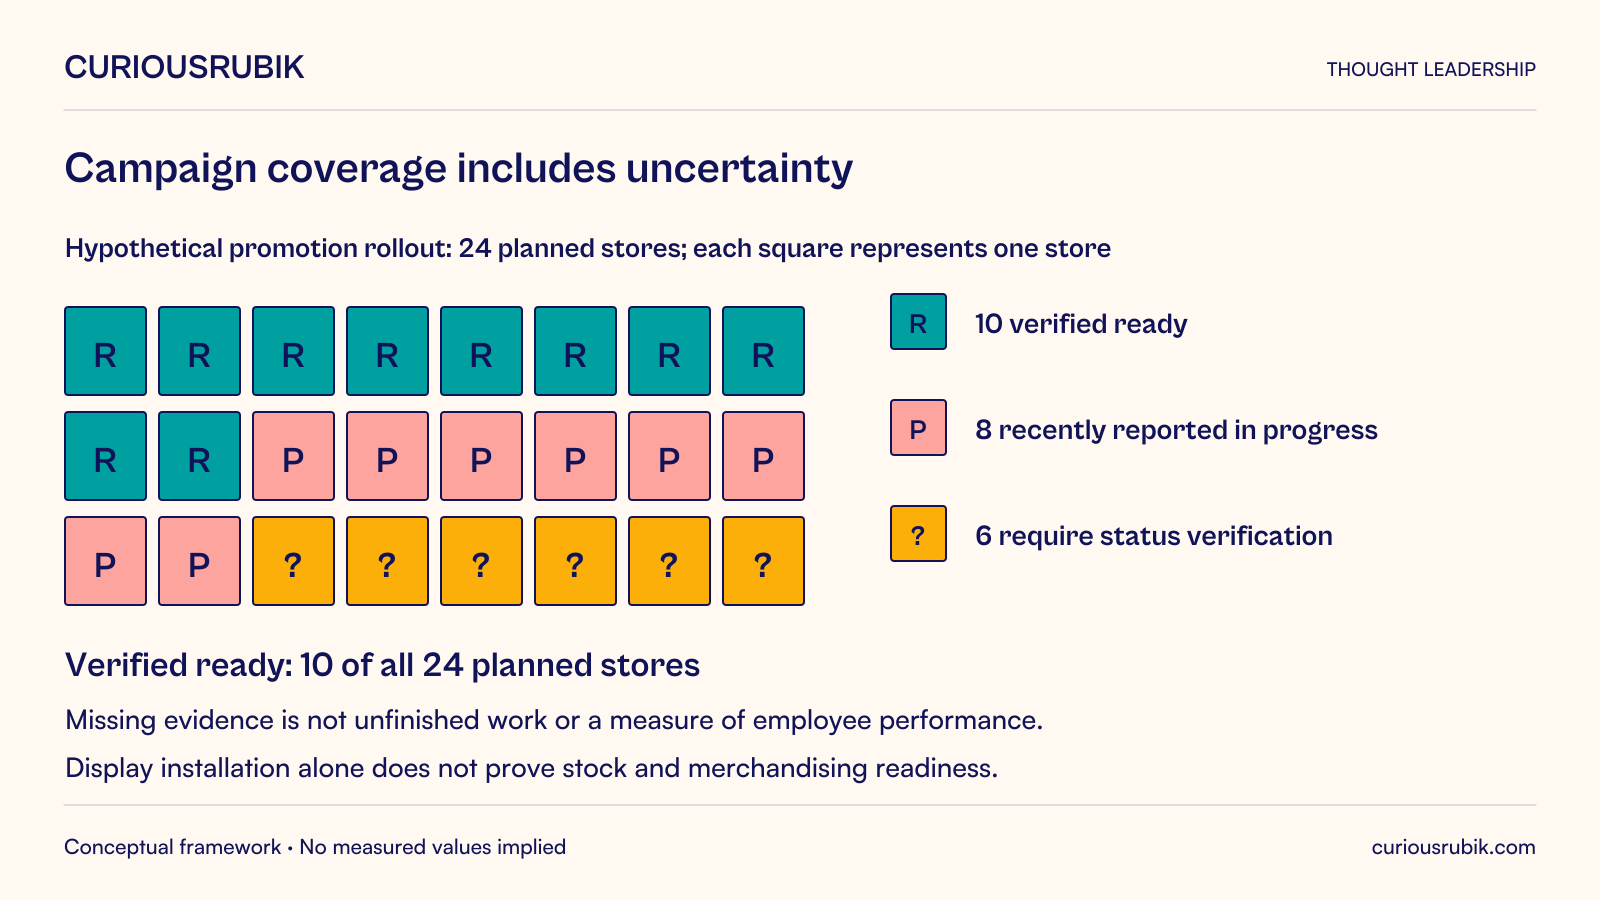
Imagine a hypothetical retailer preparing a promotion in 24 stores. Each location must install the approved display, confirm the relevant stock arrangement, and obtain the campaign owner’s defined merchandising verification. At the review point, 18 stores have recent usable reports: ten have verified readiness and eight report installation in progress. Six stores have no recent usable report.
A simplistic dashboard might show ten of 18 reporting stores complete, or about 56 percent, without explaining that six planned locations are absent from the observed population. Another might show ten of 24 verified, or about 42 percent, which is a useful lower bound on confirmed coverage but does not reveal how much uncertainty remains. Both calculations use invented inputs for illustration.
The better operational view presents all three groups: ten verified ready, eight recently reported in progress, and six requiring status verification. It also shows the reporting window and why a record is stale or missing. The regional manager can then decide where to send missing materials, which locations need a merchandising check, and whether proposed local advertising matches confirmed store readiness.
Suppose one of the six stores has finished installation, but its device has not transmitted the evidence. The board should not assert that the employee is late. It should indicate that no current server-accepted evidence is available. The manager can use the approved fallback to establish status without confusing a reporting gap with an execution failure.
A different store may have installed the display but lack stock for the advertised product. Its installation task is complete while campaign readiness remains blocked. That distinction makes the event model more useful than a photograph count: a correct display photograph does not establish that customers can obtain the promoted item.
Now consider a verified display removed after damage. A later valid business transition should remove that store from confirmed campaign coverage until the issue is resolved. A chart based solely on accumulated installation events would continue to count the location as ready. Preserve the withdrawal and its reason rather than quietly rewriting the earlier installation report.
The board helps the manager intervene within the promotion window. It can support material replenishment, targeted verification, or an approved change to campaign execution. Its value does not follow simply from refreshing the screen every few seconds, and the event stream should not be repurposed into unsupported judgments about individual effort.
Track the clocks that explain freshness
A mobile event can have several relevant times: when the worker says the event occurred, when the device recorded it, when the server received it, and when the dashboard incorporated it. These timestamps answer different questions and should not be silently substituted for one another.
If a device reconnects after an hour, receipt time makes an old event look newly observed. If the device clock is incorrect, capture time may misstate the sequence. Preserve the available timestamps and their provenance, and flag unreliable values rather than pretending every event has exact chronological certainty.
RFC 3339 defines an interoperable timestamp format including UTC or numeric offsets. A conforming timestamp representation does not establish clock accuracy or the truth of the event it describes. That remains an application and operational concern. RFC 3339, Section 5.6
Set freshness expectations by decision. A campaign-readiness decision near launch may need a shorter window than a monthly service analysis. One organization-wide stale threshold is unlikely to fit every use. Record the chosen threshold, owner, and consequence, and make the current age visible to the decision-maker.
Late events also need a defined effect. They may correct a historical view without overriding a newer valid operational state. Design ordering and reconciliation rules around business sequence and version, not arrival time alone.
Measure coverage alongside speed
A low reporting delay can be misleading if it is calculated only from the records that arrived. The missing records may be precisely the ones that matter. Pair latency measures with coverage: how much expected work has usable evidence for the relevant period?
Maintain an expected-work population from an authoritative assignment or schedule where one exists. Reconcile mobile reports to it, including canceled and reassigned tasks. Otherwise, a task removed from one employee’s list may disappear from the dashboard without anyone establishing who owns it now.
Report unresolved categories separately. Not assigned, not started, in progress, completed awaiting acceptance, confirmed complete, and no current evidence can lead to different actions. Keep the number of categories manageable, but do not simplify away differences that change the decision.
Inspect the tail of the distribution. A median reporting delay can look healthy while a small set of consequential jobs remain invisible for hours. Review the oldest unresolved items and their causes, especially when the manager’s intervention window is short.
Close the loop between alert and action
An alert should identify a condition, the evidence supporting it, and the owner expected to respond. For the retail example, an alert might flag stores with uncertain status approaching the promotion window. It should lead to a task or queue where responsibility can be accepted, rather than disappear after someone dismisses a notification.
Control repeated alerts. If several updates describe the same unresolved condition, combine them into one managed issue when appropriate. Otherwise, the system can amplify a reporting problem into an attention problem. Record escalation rules for unacknowledged or unresolved cases.
Distinguish response from resolution. A manager acknowledging an alert does not make a store ready for the promotion. Track whether the operational state changed, the uncertainty was resolved, or an authorized decision accepted the risk. This provides a more meaningful measure of intervention effectiveness than notification-open rates.
Give employees feedback on corrections and outcomes. If a submitted issue led to reassignment or required clarification, show that result in the workflow. A one-way reporting system asks people to maintain data quality without helping them understand which details are useful.
Protect trust in operational data
Explain what is collected, who can see it, and how it will be used. Avoid quietly repurposing task events into individual performance judgments without appropriate review and communication. A status gap caused by connectivity should not become an unsupported conclusion about effort or conduct.
Use access controls that match responsibility. A campaign planner may need store readiness but not employee notes or detailed device information. A support analyst may need synchronization diagnostics but not customer information. Designing these views separately can reduce unnecessary exposure.
Audit the dashboard’s interpretation periodically. Choose a sample of work items and compare the displayed state with the accepted source events and real operational outcome. Investigate discrepancies before adding more indicators. A smaller trusted view can support better decisions than a comprehensive board whose labels nobody believes.
The next useful step is to specify one operational decision, its expected-work denominator, and the evidence required to make it. Prototype the view with missing, stale, corrected, and late-arriving reports, not just complete data. Fund wider mobile visibility when the manager can explain what is known, what remains uncertain, and what action follows from each condition.